22 Warehouse KPIs Every Manager Should Know
Jan 11th 2024
 Given the lofty demands of modern supply chain management, enterprises need every advantage. This is best achieved through data-driven strategies, backed by metrics that reveal where bottlenecks and inefficiencies occur. Key performance indicators (KPIs) drive this effort, demonstrating not only where improvements are needed but also where (and how much) progress has been achieved.
The struggle is not whether to implement a data-driven approach but rather determining which KPIs to track and how to leverage these insights to drive strong outcomes. Tracked KPIs should provide valuable and actionable insights that open the door to impactful process improvements.
In this guide, we have identified several of the most critical KPIs in supply chain management and categorized these based on the components of supply chain management that are most prone to inefficiencies and other concerns. Keep reading to discover how the most important warehouse KPIs can make a world of difference.
Inventory Management KPIs
 Your inventory forms the basis of your entire warehouse operation, so it must be tracked carefully to ensure that it is properly managed and that it moves efficiently throughout all areas of the supply chain. Examples of inventory management KPIs worth obtaining and analyzing include:
1. Inventory Accuracy
As the foundation of warehouse management, inventory accuracy references the extent to which the goods in stock within the facility match those that have been digitally captured in the warehouse management system. Its importance cannot be overstated, as it has a direct impact on order fulfillment and customer satisfaction.
2. Shrinkage
 This term references any loss in inventory or assets that does not occur due to sales. A variety of issues can prompt shrinkage, such as misplaced items or even theft. Shrinkage can heavily cut into profits, so it must be monitored carefully and addressed promptly if it becomes more common. Inventory shrinkage rates can be determined by dividing losses by the amount of inventory that should be present.
3. Carrying Cost of Inventory
Inventory carrying costs reveal how expensive it is to keep items in stock before they are able to fulfill orders. Several factors play into this cost, such as expenses associated with operating and maintaining the warehouse, plus the cost of labor and insuring the inventory. The carrying cost should not exceed 30 percent of the value of the inventory.
Carrying costs are often calculated by dividing the total value of the inventory by the holding sum. The holding sum can be determined by adding the many expenses required to store inventory. If carrying costs seem excessive, they can be reduced by implementing a more efficient warehouse design or by using advanced systems to achieve real-time inventory monitoring.
4. Inventory Turnover Rate
 Inventory turnover involves how often items are sold and replaced. This KPI provides a helpful glimpse into sales volume and may also reveal whether sufficient inventory is available. A high turnover rate provides a promising sign of strong sales.
There are multiple methods available for calculating the rate of inventory turnover. Top tactics include dividing the number of sales by the average inventory or dividing the cost of goods sold by the average inventory. The resulting figure can then be compared to industry benchmarks to reveal whether your organization is faring as well as top competitors in your sector.
5. Inventory to Sales Ratio
Inventory to sales ratio can provide helpful insight into cash flow concerns while also revealing how much stock should be purchased to maintain sales levels without leading to excessive back orders. Calculating this ratio begins with determining how much inventory remains at the end of the month. This can then be divided by the total sales for that month.
Receiving Process
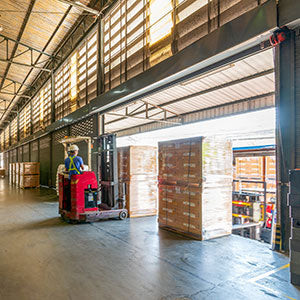 The receiving area can be a huge source of inefficiency, particularly if labor is under or over-allocated. Receiving process KPIs determine whether solutions are sufficiently streamlined and which strategies can be implemented to expedite the receiving process.
6. Receiving Efficiency
This KPI determines whether workers in the receiving area are sufficiently productive. It can be calculated by determining the total volume of inventory received and dividing this by the staff hours dedicated to these processes. Low receiving efficiency may indicate that additional training is required or that better equipment is needed to expedite essential tasks such as unloading or verification.
7. Cost of Receiving Per Line
How much does it cost to receive a particular line of items from a top vendor? This calculation will determine the cost of receiving per line, which, in turn, offers a reliable indication of the overarching cost of goods sold. This is important for determining general profitability. The cost of receiving per line can be calculated by dividing the number of items received by the total cost of receiving.
8. Receiving Cycle Time
Receiving cycle time determines how long it takes to process critical stock. If the average cycle time is short, this means that current processes are highly efficient. A long cycle time suggests that the receiving area does not currently have enough time to process deliveries effectively.
Putaway Process
 After deliveries have been received, a variety of steps must be taken before they can be stored in optimal locations. This series of steps makes up the putaway process, which must be optimized to improve efficiency but also calls for a high degree of accuracy. After all, issues with the putaway process can escalate to bigger problems with order fulfillment.
9. Accuracy Rate
Ideally, all items will be put away correctly from the get-go. The accuracy rate confirms whether putaway processes are carried out appropriately. To calculate this, divide the amount of inventory handled correctly by the total amount of inventory put away. Ideally, the result will total one or close to one, as this indicates that all items are being properly put away.
10. Putaway Cost Per Line
Similar to the receiving cost per line but applied to the putaway process, this figure reveals which costs are incurred between receiving and storage. Again, a high cost per line indicates that the putaway process is not particularly efficient and may also reveal that inaccuracies are present.
11. Putaway Cycle Time
This metric also resembles its counterpart from the receiving process. The goal is the shortest cycle time possible without compromising putaway accuracy. The cycle time can be determined by calculating how long it takes, on average, to put away a single inventory item.
Order Fulfillment KPIs
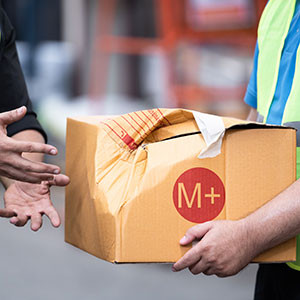
The order fulfillment process plays a critical role in determining not only whether orders are completed accurately but also how long this takes and whether customers are ultimately satisfied with their experience. As such, these are among the most important supply chain metrics. Essentials include:
12. Picking Accuracy
 Inaccurate orders must be avoided, as this increases the potential for inventory to be returned to storage. What's more, issues with picking accuracy can have a detrimental impact on shipping time and even customer satisfaction. Picking accuracy is best revealed by determining how many orders have been picked and verified as accurate and then dividing that figure by the total number of items picked within a particular timeframe.
13. Total Order Cycle Time
This metric reveals how much time the entire ordering process takes from the consumer's perspective. This calculation begins with subtracting the time when the order was placed from the time it was received by the customer.
If this figure is higher than anticipated, it can be reduced by optimizing the picking process (typically by improving the warehouse layout or by strategically slotting SKUs) or by shifting resources to account for areas with higher order activity. Every minute that can be shaved off the order time will make a huge difference.
14. Order Lead Time
 Often simply referred to as "lead time," the order lead time is a simple yet influential metric that reveals how long it takes customers to receive orders after they are placed. This has a huge impact on customer satisfaction and, naturally, a shorter lead time is always better. Furthermore, the lead time can influence how much inventory needs to be carried at any given time. If the order lead time seems long, it may be necessary to take a closer look at other KPIs to determine where bottlenecks may be occurring.
15. Backorder Rate
Backorders occur when customers want to purchase items that are not currently in stock. These are best avoided as backorders can cause significant delays and can limit customer satisfaction. While the backorder rate may occasionally seem high if sudden fluctuations in demand occur, a consistently high backorder rate should be cause for concern.
To pinpoint this metric, divide the number of unfulfilled orders by the total orders placed. If you need to decrease a high backorder rate, place a greater emphasis on forecasting initiatives while also striving to reduce inventory-to-sales ratios.
16. Fulfillment Accuracy Rate
Picking accuracy and fulfillment accuracy are not one and the same. The latter occurs when the right customer receives the right order at the right time. There are plenty of problems that can occur after picking is complete, and if the picking accuracy rate is high but the fulfillment accuracy rate is low, shipping processes may require closer examination.
17. On-Time Shipping Rate
 Are orders shipped according to the promised deadlines? If they take longer to ship than expected, customer satisfaction is bound to suffer. Also referred to as on-time delivery (OTD), the on-time shipping rate can be calculated by dividing the total deliveries within a set period by the late periods that occurred during that time. Other metrics can reveal how long it actually takes to deliver these orders and how much time drivers spend dropping off items or interacting with customers.
18. Cost Per Order
How much does it actually cost to fulfill customer orders? The total cost of fulfillment encompasses all the expenses incurred along the way: the many expenses related to receiving, putaway, picking, shipping, and more. Total costs can be calculated not only by order but also by line or box. If these costs seem high, it is possible that hidden operational efficiencies stand in the way, although high storage expenses, shrinkage, return rates, and many other concerns can also come into play.
19. Rate of Returns
After orders are fulfilled, do customers actually keep the products they've purchased? If they return items, it is possible that they are unhappy with the quality of the products or have other complaints. The rate of return can be calculated by comparing how many units are returned against the total items sold. Ideally, return rates will be as low as possible, although it is still important to maintain an easy and expedited return process. Consider also determining the causes that underscore returns so that these can be appropriately addressed to hopefully reduce the overall rate of return.
20. Customer Satisfaction Scores
 Customers are satisfied when they receive the right orders quickly and in excellent quality. When these basics are achieved, customer satisfaction scores will be high. There are multiple ways to verify customer satisfaction, and while return rates may provide some indication of whether customers are happy with their experience, targeted feedback obtained directly from consumers may be more insightful. This can be gathered by sending surveys, requesting ratings, or seeking engagement on social media.
Warehouse Safety KPIs
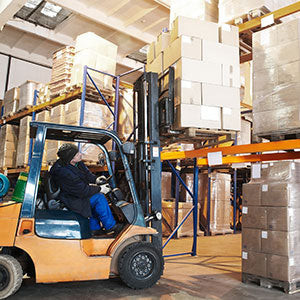
Initiatives that appear to improve productivity or accuracy can have a detrimental impact on warehouse safety, so these factors must be balanced carefully to ensure that workers avoid hazards such as falling objects or forklift accidents. Warehouse safety KPIs can provide valuable insight into how safe this environment is. If the following metrics reveal any safety concerns, these must be dealt with promptly.
21. Accidents Per Year

Ideally, this number would always be zero. It is important to always continue striving for this ambitious, but important benchmark. If the number of accidents increases in any given year, it will be necessary to take a closer look at recent changes (such as new processes, policies, or technologies) to determine whether these are having a detrimental impact on workers.
22. Time Since Last Accident
If you have implemented new safety protocols, tracking the time since the last incident can help verify that these solutions are actually effective. If the time between accidents decreases significantly, there is likely a safety issue in the warehouse that needs to be addressed as soon as possible. Typically measured in days, this metric will ideally remain high.
Setting & Monitoring Metrics
 Now that you know which metrics to use, it's time to establish benchmarks and begin tracking these KPIs carefully. A strategic, well-thought-out approach will ensure not only that you properly gather warehouse data but also that you make the most of these insights.
Continuous data collection ensures that you understand your progress towards previously set benchmarks and also recognize which problems stand in the way of achieving these objectives. A variety of tools and technologies can be used to gather this information. Many warehouses rely on wearable devices, barcode scanning, and RFID systems. Additional metrics can be gathered as orders are fulfilled and especially as customers provide feedback through surveys and other mechanisms.
Keep in mind that your goals and benchmarks may vary over time. Adjustments could come into play if your initial objectives seem out of line with what your warehouse can reasonably handle. Other changes may be necessary as the scale of your operation shifts.
Improve Warehouse Performance with WH1
As you strive for efficient, data-driven supply chain solutions, look to Warehouse1 for support. We offer the services and solutions needed to optimize your warehouse's layout and streamline every step in the fulfillment process.
If, as you track the KPIs references above, you observe consistent issues with critical metrics, it might be worth your while to invest in warehouse reconfiguration services, which can address everything from safety concerns to stubborn sources of operational inefficiency. Meanwhile, our warehouse design solutions ensure that your operation is in peak condition from the get-go. We are happy to provide the guidance you need, so don't hesitate to get in touch.