How to Build a Business Case for Warehouse Automation
Jul 21st 2026
A Five-Step Framework for Getting Warehouse Automation Approved by Finance
You already know you need to automate. Getting from "we know we need this" to "finance approved it" is where most projects die — not on the technology, but on the paper. Here's the framework that fixes that.
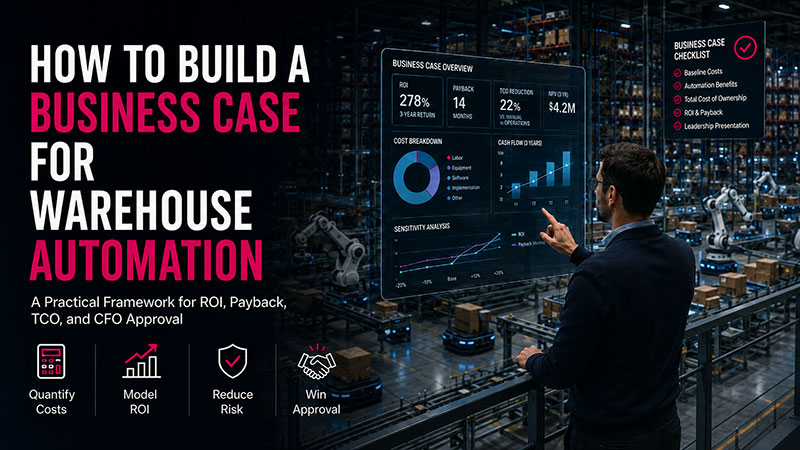
For most warehouse operations, the case for automation is already there on the floor. It shows up as unfilled open positions, as 60-plus hours of overtime each peak, as returned orders and chargebacks that shouldn't exist, and as a square footage problem that leasing more space won't solve. Operations managers feel all of this acutely. But feeling a problem and being able to present a defensible, finance-grade business case for solving it are two different skills, and the gap between them is exactly where automation investments stall.
The evidence is specific: when the Material Handling Institute asked supply chain leaders to name their biggest obstacles to automation, the two answers weren't technology complexity or change management. They were budget constraints (41%) and unclear ROI (40%) — not the automation itself, but the inability to quantify and communicate the case for it (MHI, 2025 Annual Industry Report). This guide gives you the framework to close that gap.
|
41%
of supply chain leaders cite budget constraints as their top barrier to automation adoption
|
40%
cite unclear cost and ROI as a barrier — not the technology, but the financial case for it
|
The 5-Step Business Case Framework
These steps build on each other. You can't accurately size benefits without first measuring the status quo. You can't build a credible financial model without a realistic total cost. And you can't get finance approval without all three in a format they recognize.
1. Quantify the Status Quo: What Does Doing Nothing Actually Cost?
The most underbuilt section of almost every automation business case is the baseline. Operations leaders often lead with "here's what automation will cost," when the first question finance actually wants answered is "what is the current operation costing us right now?" Start there.
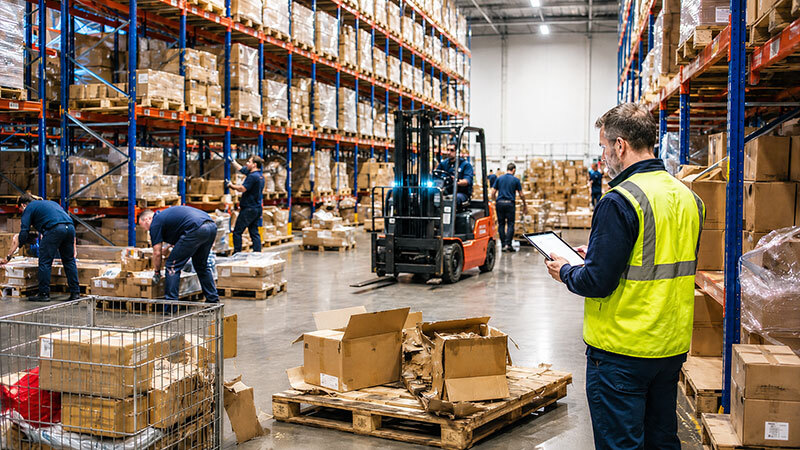
Labor. Your fully loaded labor cost is not your hourly wage rate. Add benefits, overtime, workers' compensation, supervision overhead, recruiting fees, and the recurring cost of turnover. Fully loaded labor typically runs 1.3–1.5× the base hourly wage. Then layer in turnover: the Bureau of Labor Statistics-derived turnover rate for warehouse workers runs around 36% annually in most analyses, and replacing a position typically costs between 25% and 150% of that employee's annual salary — once recruiting, onboarding, and lost productivity are counted (Open Sky Group, citing BLS analysis). That means a team of 30 workers at $22/hour isn't a $1.37 million annual labor line — it's closer to $1.9 million once fully loaded, and rising at approximately 4% per year in current wage markets.
Order errors. A 1% picking error rate is widely considered acceptable. It shouldn't be. Industry research consistently puts the fully loaded cost of a single mis-pick in the range of $50–$220 per incident for B2B operations, once return processing, re-shipment labor, expedited freight, customer service time, and inventory adjustment are factored in (Voxware; NetSuite). Across a mid-size distribution center, the annual losses from mispicks routinely total $400,000–$600,000 before any impact on customer retention is counted (Voxware). A distribution center processing 500 orders per day at a 1% error rate and $75 average cost per error is absorbing roughly $97,500 in direct annual error costs — at a minimum.
Space. If your facility is near capacity, the relevant number isn't square footage — it's the cost of the next real estate decision you'll face without automation. Industrial lease rates in most major U.S. markets currently run $10–$20 per square foot per year. If you're considering an expansion or a second facility, that anticipated cost belongs in your status-quo calculation.
Safety. Count the most recent 12 months of workers' compensation claims, incident-investigation time, and productivity losses from injuries. In a high-turnover manual environment, these numbers add up faster than most operations teams have formally calculated.
Sources: Open Sky Group, citing U.S. Bureau of Labor Statistics; Voxware, "The Cost of a Mis-Pick"; NetSuite.
2. Size Your Automation Benefits with Your Own Data
|
Labor Savings
Well-scoped automation projects typically reduce direct labor requirements by 30–50% within the automated zone. Model 30% as your conservative case; use your actual throughput and task-time data to support higher estimates. Redeployment (moving workers to value-added tasks) rather than elimination is the more defensible and realistic planning assumption. |
Accuracy Improvement
Manual picking operations typically run at 95–98% accuracy. Best-in-class automated systems consistently achieve 99.5–99.9%. Apply that gap to your annual order volume and your actual cost per error (from Step 1) to produce a specific dollar figure for your business case, not a generic industry average. |
|
Space Recovery
Automated Storage and Retrieval Systems (ASRS) and Vertical Lift Modules can dramatically increase storage density within your existing footprint, often recovering 25–85% of floor space depending on system type. Size this as deferred expansion cost if that's the real decision you're facing — avoiding a building addition is often the single largest line in the business case. |
Safety & Throughput
Automating the highest-risk movements reduces workers’ compensation exposure directly. Separately, consistent automated throughput — unaffected by turnover, absenteeism, and peak-season capacity gaps — often enables revenue that the manual operation couldn’t capture reliably. Model these conservatively; even partial credit adds meaningfully to the total benefit. |
Source: The New Warehouse, January 2026.
3. Model Total Cost of Ownership Not Just the Sticker Price
The most common way automation business cases fail a CFO review isn't overstating benefits — it's understating costs. Presenting only the equipment purchase price, then being asked about integration, installation, and maintenance in the meeting, destroys credibility instantly. Account for all of these upfront.
| Cost Category | Typical Range | Common Omission? |
|---|---|---|
| Equipment / hardware | Primary CapEx line | No — usually quoted |
| WMS / WCS integration & IT | 10–20% of hardware CapEx | Yes — frequently missed |
| Installation & commissioning | 10–15% of hardware CapEx | Sometimes missed |
| Training & change management | 3–5% of total project cost | Yes — frequently missed |
| Contingency | 10–15% of total project | Yes — almost always missed |
| Annual OpEx (maintenance, software, energy) | 5–8% of CapEx per year | Yes — most common omission |
The OpEx line deserves special emphasis. A system priced at $1.5 million will generate $75,000–$120,000 in annual operating costs. Over a five-year model, that's $375,000–$600,000 that a CapEx-only presentation doesn't account for. Finance will calculate it themselves. Present it first, with sourced assumptions, and you'll earn credibility in the room rather than lose it.
Annual OpEx range: GoASRS.com ROI Guide; integration and contingency ranges: industry practitioner consensus, MHI Annual Industry Report.
4. Build the Financial Model: ROI, Payback, and IRR
With the status quo quantified, benefits sized, and full costs modeled, the financial outputs are straightforward arithmetic. These are the three numbers that matter most to capital-allocation decision-makers.
Source: MHI industry benchmark ranges, as cited in Modern Materials Handling Warehouse Automation Guide and GoASRS ROI Guide.
IRR is often the deciding metric for finance teams evaluating competing capital projects. Industry practitioners report that most companies require automation projects to clear a hurdle rate of 12% or higher, and well-scoped projects typically achieve IRR in the 20s, providing meaningful margin above that threshold (The New Warehouse, citing TGW Logistics). If your finance team has a published hurdle rate, run your model against it explicitly. Showing that your project clears the bar by 8–12 percentage points is more persuasive than any narrative about operational necessity.
Source: The New Warehouse, January 2026, citing TGW Logistics Director of Sales.
ROI Estimator: Run Your Own Numbers
This estimator gives you an order-of-magnitude starting point using your facility's own inputs. Use it to sense-check whether your operation is likely to hit a 2–4 year payback. A full engineering-grounded model from a qualified integrator will be more precise. This shows you whether the conversation is worth having.
| Include all pickers, packers, and replenishment staff | Base wage only — we'll apply the 1.4× fully-loaded multiplier | ||
| Reduction in direct labor hours from automation in affected zones | Average daily outbound orders | ||
| Industry average is 1–3%; best manual operations reach 0.5% | Include re-ship, return processing, CS time, and chargebacks ($50–$220 typical) | ||
| Full project cost including equipment, integration, and 12% contingency | |||
5. Present to Leadership in the Language Finance Uses
CFOs are not trying to block good investments. They're trying to make good capital allocation decisions with limited time and dozens of competing proposals. The operations leaders who get approved aren't better at arguing — they're better prepared. Three practices separate proposals that get approved from ones that get deferred.

Lead with the number, not the problem. Don't open a finance presentation by explaining the warehouse's pain points. Open with the ask: "We're requesting $X for a [system type] deployment. Our model shows a [Y-year] payback at a [Z%] IRR, against your [hurdle rate]% hurdle. Here's how we built those numbers." Finance already knows there are operational problems — that's why you're in the room. Lead with the financial outcome.
Run three scenarios, not one. A single ROI projection reads like marketing. Three scenarios — conservative, base case, and aggressive — read like analysis. Your conservative case should assume lower labor savings, slower adoption, and 15–20% higher implementation costs than your base case. If the conservative case still clears your hurdle rate with a payback under four years, your project will survive every objection that comes at it.
| Scenario | Labor Reduction | Error Savings | Payback Period |
|---|---|---|---|
| Conservative | 15–20% | 60% reduction | 4–5 years |
| Base Case | 25–35% | 80% reduction | 2.5–3.5 years |
| Aggressive | 40–50% | 95% reduction | 1.5–2 years |
Address implementation risk before you're asked. Finance teams have seen automation projects go sideways. They'll ask about integration complexity, change management, and what happens if the system underperforms in year one. Have a specific answer for each, including a named internal project owner, a go-live criteria checklist, and a contingency budget already in your numbers. The presenter who pre-empts those questions earns trust. The one who deflects them gets a deferral.
Bonus: 4 Things That Kill an Automation Business Case

Frequently Asked Questions
Build a Business Case That Gets Approved — With Expert Help
The numbers are almost always there. Pulling them together in a format that survives a CFO review is where most operations teams need a hand. Warehouse1’s team will walk your operation, model the ROI against your actual facility and data, and give you a business case grounded in engineering estimates — not vendor assumptions. No pressure. No obligation.
About Warehouse1
Warehouse1 has been solving material handling and warehouse automation problems since 1988. As a 100% employee-owned company based in Kansas City, Missouri, Warehouse1 acts as a single point of accountability from design through supply and installation — evaluating ASRS, vertical lift modules, robotics, automated conveyor, and pick module systems on their merits, not on which one is easiest to sell. Warehouse1 serves distribution centers, e-commerce, automotive, aerospace, and food and beverage operations, and is a member of the Material Handling Equipment Distributors Association (MHEDA).
| Smarter Solutions, Not Just SKUs. Solutions designed around your operation's actual needs and goals, not a product catalog. | One Partner. End-to-End Execution. From facility assessment and layout design to installation and post-go-live support. |
| Easy to Work With at Every Stage. Simplifying complex projects and reducing operational disruption throughout. | Trusted Expertise. Proven Results. Decades of practical experience across the full range of material handling systems. |
Sources & Further Reading
- MHI, 2025 Annual Industry Report (with Deloitte)
- Open Sky Group — Warehouse Automation Statistics 2026, citing BLS
- Voxware — The Cost of a Mis-Pick
- NetSuite — The Cost of Picking Errors
- CPCON Group — Warehouse Automation ROI: CFO Financial Analysis Guide
- GoASRS — Warehouse Automation ROI Guide
- Modern Materials Handling — Complete 2026 Warehouse Automation Guide
- The New Warehouse — Helping Leadership Justify Automation Investment, 2026
- MHEDA — Material Handling Equipment Distributors Association